India Trade Data: May 2026 and April–May 2026-27
India’s total exports (goods and services combined) in May 2026 are estimated at US$ 81.96 billion, up 15.83% from US$ 70.76 billion in May 2025. Total imports rose…
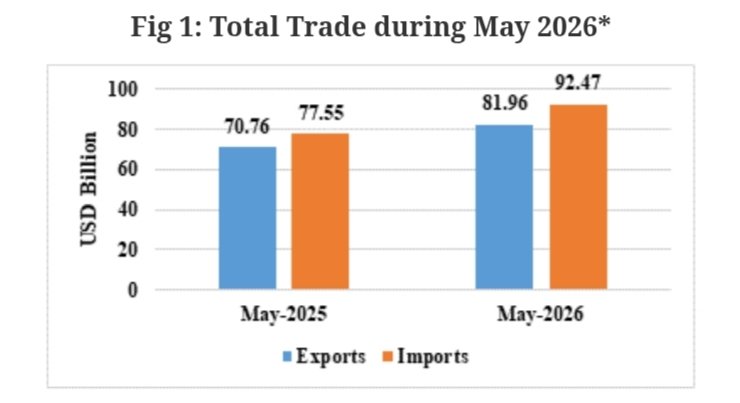
India’s total exports (goods and services combined) in May 2026 are estimated at US$ 81.96 billion, up 15.83% from US$ 70.76 billion in May 2025. Total imports rose 19.23% to US$ 92.47 billion from US$ 77.55 billion, resulting in a trade deficit of US$ 10.51 billion.
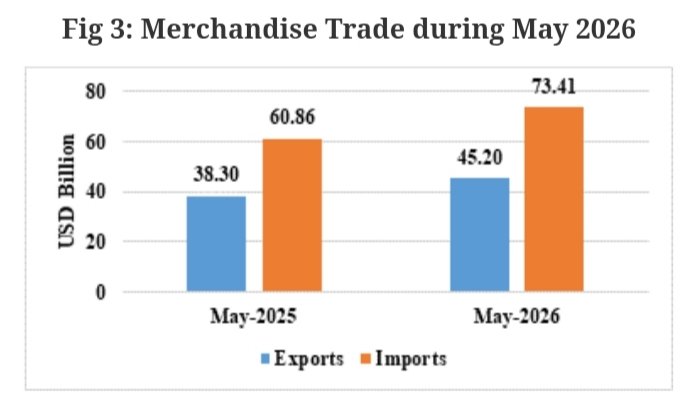
Merchandise exports in May 2026 increased to US$ 45.20 billion from US$ 38.30 billion a year earlier. Merchandise imports climbed to US$ 73.41 billion from US$ 60.86 billion, reflecting strong growth in trade activity.
Services exports for May 2026 are estimated at US$ 36.76 billion, compared with US$ 32.46 billion in May 2025. Services imports rose to US$ 19.06 billion from US$ 16.70 billion, keeping India in a healthy services trade surplus position.
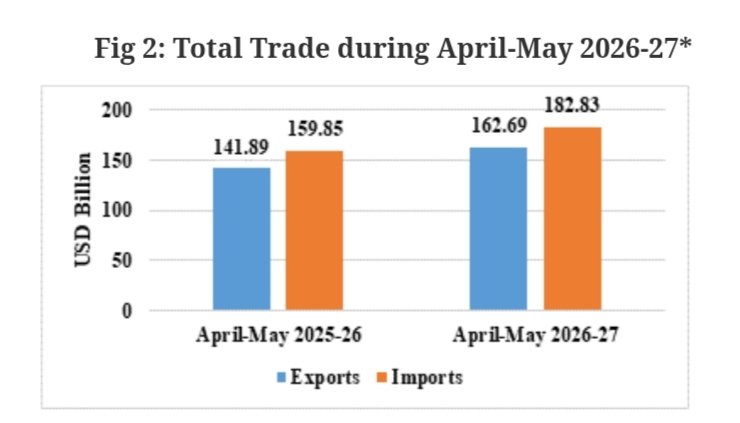
For the first two months of FY27 (April–May 2026-27), total exports are estimated at US$ 162.69 billion, up 14.66% from US$ 141.89 billion in the same period last year. Total imports increased 14.38% to US$ 182.83 billion, while the overall trade deficit widened to US$ 20.13 billion from US$ 17.96 billion.
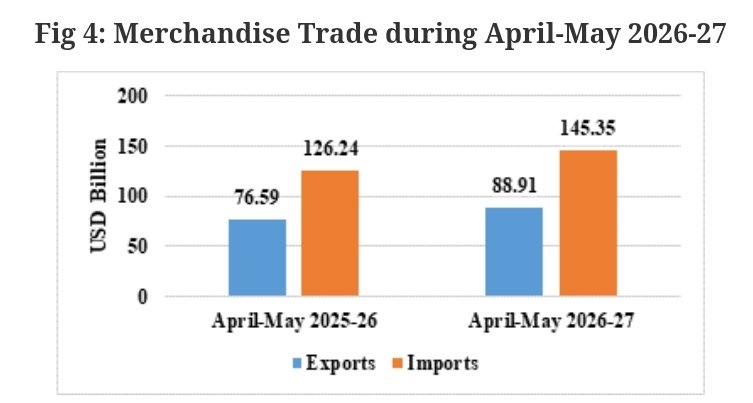
Merchandise exports during April–May 2026-27 reached US$ 88.91 billion, registering 16.09% growth over US$ 76.59 billion last year. Merchandise imports increased to US$ 145.35 billion from US$ 126.24 billion, resulting in a merchandise trade deficit of US$ 56.44 billion.
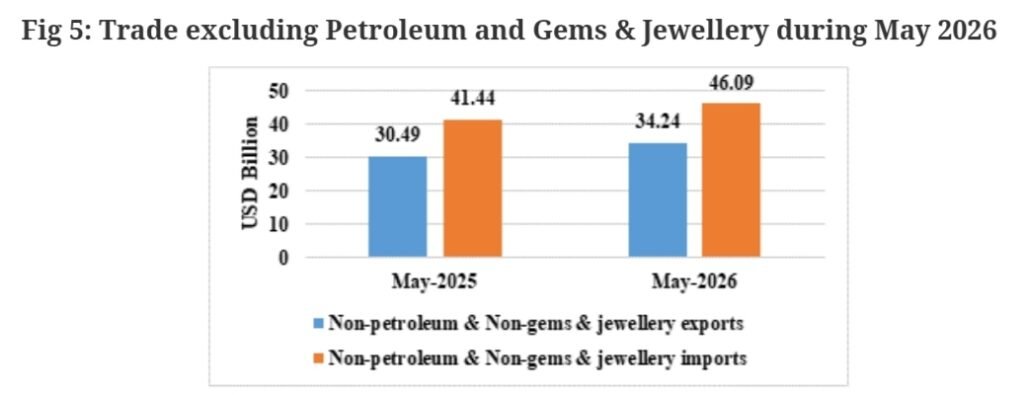
Non-petroleum exports during April–May 2026-27 stood at US$ 70.74 billion, up from US$ 64.03 billion, a growth of 10.49%. Non-petroleum and non-gems & jewellery exports rose to US$ 65.89 billion from US$ 59.15 billion, while corresponding imports increased to US$ 91.97 billion from US$ 81.19 billion.
Services exports during April–May 2026-27 are estimated at US$ 73.79 billion, compared with US$ 65.30 billion a year ago. Services imports rose to US$ 37.48 billion from US$ 33.61 billion, taking the services trade surplus to US$ 36.31 billion, up from US$ 31.69 billion.
Major export drivers in May 2026 were Petroleum Products, Engineering Goods, Organic & Inorganic Chemicals, Electronic Goods, and Gems & Jewellery. Petroleum product exports jumped 54.89% to US$ 8.42 billion, Engineering Goods rose 24.48% to US$ 12.31 billion, Chemicals increased 12.71% to US$ 2.72 billion, Electronic Goods grew 11.62% to US$ 5.10 billion, and Gems & Jewellery exports rose 6.66% to US$ 2.53 billion.
Among export categories, the highest growth was seen in Other Cereals (+262.73%), followed by Petroleum Products (+54.89%), Meat, Dairy & Poultry Products (+42.51%), Oil Meals (+24.61%), and Engineering Goods (+24.48%). Imports of Silver (-86.65%), Project Goods (-64.05%), Chemical Materials (-63.58%), and Pearls & Precious Stones (-26.5%) recorded sharp declines.
Singapore, South Africa, Tanzania, Italy, and Sri Lanka were among the fastest-growing export destinations in May 2026. On the import side, the strongest growth came from Russia (+63.46%), China (+23.4%), USA (+54.43%), Oman (+305.66%), and Brazil (+358.83%). For April–May 2026-27, Singapore, Tanzania, Sri Lanka, South Africa, and China led export growth, while Russia, China, Oman, USA, and Brazil were the fastest-growing import sources.
Related News
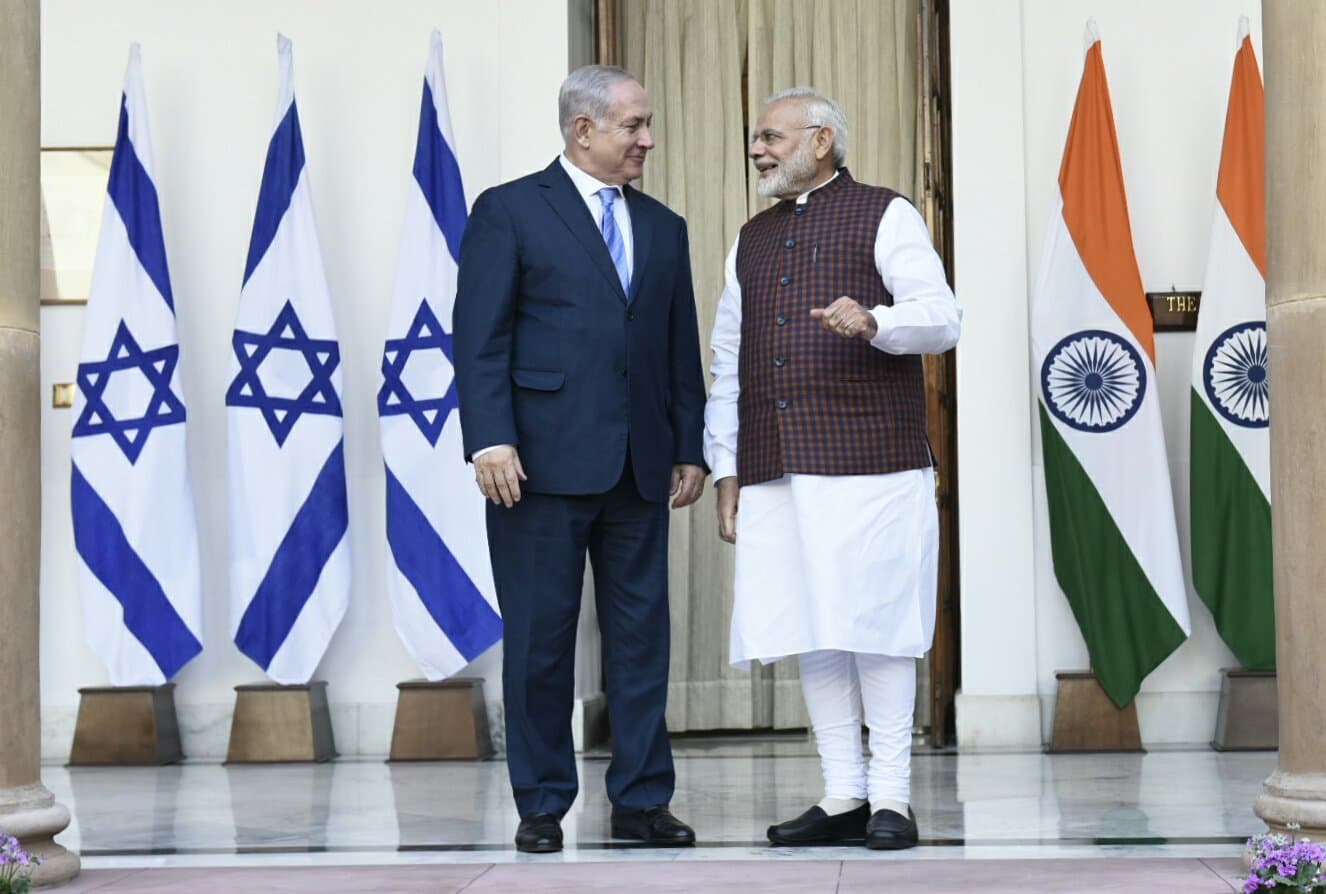
India, Israel Complete Second Round of Free Trade Agreement Talks

India’s Services Exports Hit Record USD 421.3 Billion in FY26
India’s July Flash PMI Slows to 54.3 as Inflation Pressures Intensify

US Imposes Section 301 Tariffs on India, China, EU and 57 Other Economies

India Records 21% Rainfall Deficit as Monsoon Lags, Govt Rules Out Crop Impact