Massive Stock Selloff: The Largest Since 2010
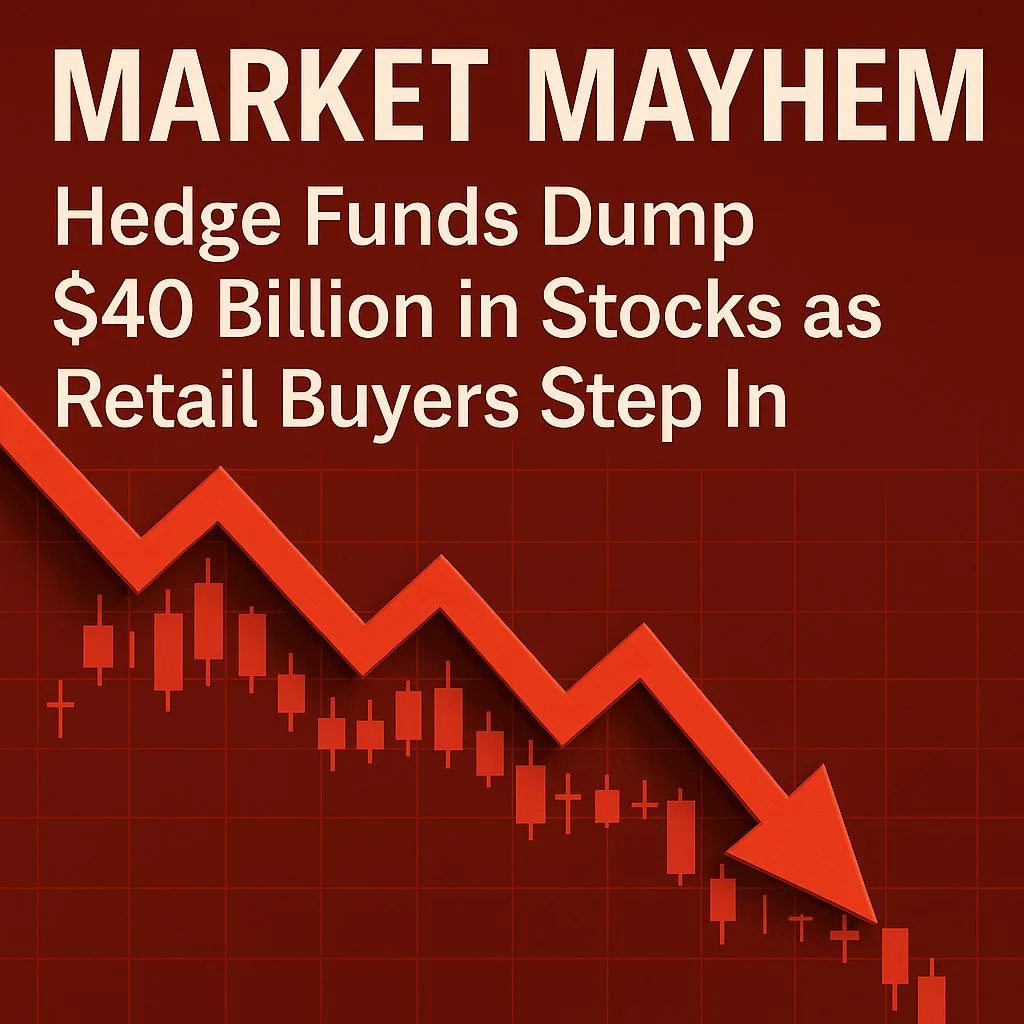
In an unprecedented move, hedge funds dumped a staggering $40 billion worth of stocks in a single day—Thursday—marking the largest one-day selloff since 2010.
What’s even more alarming? Hedge funds shorted stocks three times more than they bought. Around 75% of this activity was focused on North American equities, highlighting a sharp shift in market sentiment among institutional investors.
U.S. stock market saw a huge drop on Friday, losing almost $2 trillion in just the last hour of trading. Since Wednesday, the total loss has reached $7 trillion. Overall, the market has lost more than $11 trillion in value since Donald Trump became President.
Retail Investors Buy Big… Then Panic
Record-Breaking Retail Buying
As hedge funds rushed to exit, retail investors did the exact opposite. According to J.P. Morgan, everyday investors bought $4.7 billion worth of stocks on Thursday alone. This was the largest daily retail purchase since 2015.
Panic Selling Hits the Market
But that optimism didn’t last long. Just a day later, on Friday morning between 9:30 AM and 12:00 PM ET, retail traders sold $1.5 billion in equities. This was the biggest 2.5-hour sell-off by retail investors in history—a clear sign of panic.
The Collapse of the Magnificent 7
Nearly $1 Trillion Erased in One Day
Tech stocks led the crash. The “Magnificent 7” — including giants like Apple, Microsoft, and NVIDIA — collectively lost a shocking $990 billion in market value on Thursday. That’s even worse than the previous record loss of $760 billion on March 10.
S&P 500 Plunges $2.7 Trillion
The broader S&P 500 lost $2.8 trillion in market cap, and the Magnificent 7 alone were responsible for 38% of that loss. The Magnificent 7 Index is now down over 31% from its all-time high, deepening investor fears.
Bearish Sentiment Dominates the Market
Extreme Fear Grips Wall Street
Investor sentiment is now deeply bearish. The Fear & Greed Index has dropped to 4—a clear indicator of market fear. According to the latest AAII Sentiment Survey, only 22% of investors are bullish, while 62% are bearish. This is the third most bearish reading ever, with only March 2009 and October 1990 being worse.
Trump Misread Triggers Panic
The S&P 500’s over 10% decline in two days last week was the steepest since March 2020, driven by a widespread misreading of former President Trump’s policy signals. For the first time this year, both hedge funds and retail investors sold stocks together, hinting at a possible market capitulation.
Volatility Surges and Gold Cracks
VIX Soars Over 100 Points
The Volatility Index (VIX) spiked by 110% in one week, yet it still sits 20 points below the highs of August 5, i.e 65.73. This indicates that short-term panic selling may have already taken place, possibly setting the stage for a relief rally.
Gold No Longer a Safe Haven?
In another shocking development, gold prices dropped by $125 per ounce in just four hours, falling alongside stocks. This rare event suggests a broad-based market exit, as investors dumped all kinds of assets—not just risky ones.
Who Really Owns the Market?
While millions of investors panicked, the reality is that stock market ownership in the U.S. is heavily concentrated. The top 1% of American households own over half of all stocks, while the next 19% hold nearly all the rest. That means roughly 80% of Americans are not directly affected by stock market swings.
Final Thoughts: Are We Near a Market Bottom?
This week’s events—massive institutional selling, record-breaking retail panic, crashing tech stocks, and falling gold prices—could signal that the worst is nearing its end. Capitulation often precedes recovery, and with bearish sentiment at historical highs, the market might be setting up for a bounce.
But caution remains key. Investors should closely monitor macroeconomic indicators, earnings reports, and central bank policy before making bold moves.

BBW News Desk is the editorial team of BigBreakingWire, a digital newsroom focused on global finance, markets, geopolitics, trade policy, and macroeconomic developments.
Our editors monitor government decisions, central bank actions, international trade movements, corporate activity, and economic indicators to deliver fast, fact-based reporting for investors, professionals, and informed readers.
The BBW News Desk operates under the editorial standards of BigBreakingWire, prioritizing accuracy, verified information, and timely updates on major global developments.


Be First to Comment