Global Liquidity Set to Enter New Bullish Phase in Long-Term Cycle

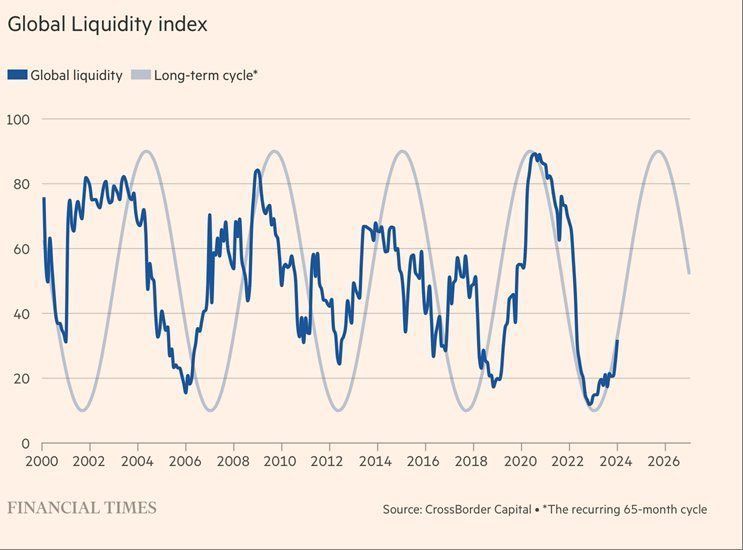
The chart displays the Global Liquidity Cycle, represented by a normalized index called the Global Liquidity Index (GLI). This index captures the momentum of global liquidity and is designed to be within a range of 0 to 100, with an average value set at 50.
The data from this chart are plotted alongside a repeating cycle, modeled as a sine wave with an average period of 65 months (approximately 5 to 6 years). This frequency was originally determined through Fourier analysis conducted over the period from 1965 to 2000 and has been extended beyond this timeframe.
By comparing the GLI with this sine wave cycle, we can assess the accuracy of the estimated cycle length. Additionally, this comparison allows us to project future peaks and troughs of the Global Liquidity Cycle.
Based on the extrapolated data, it is anticipated that the Global Liquidity Cycle will reach its next peak around September 2025, following the trough that occurred in December 2022.
Inputs from Financial Times
Bringing you the latest updates on finance, economies, stocks, bonds, and more. Stay informed with timely insights.


Be First to Comment